Credibility and Premium Valuations for Bootstrappers III, SaaS Data & Analytics Definitions
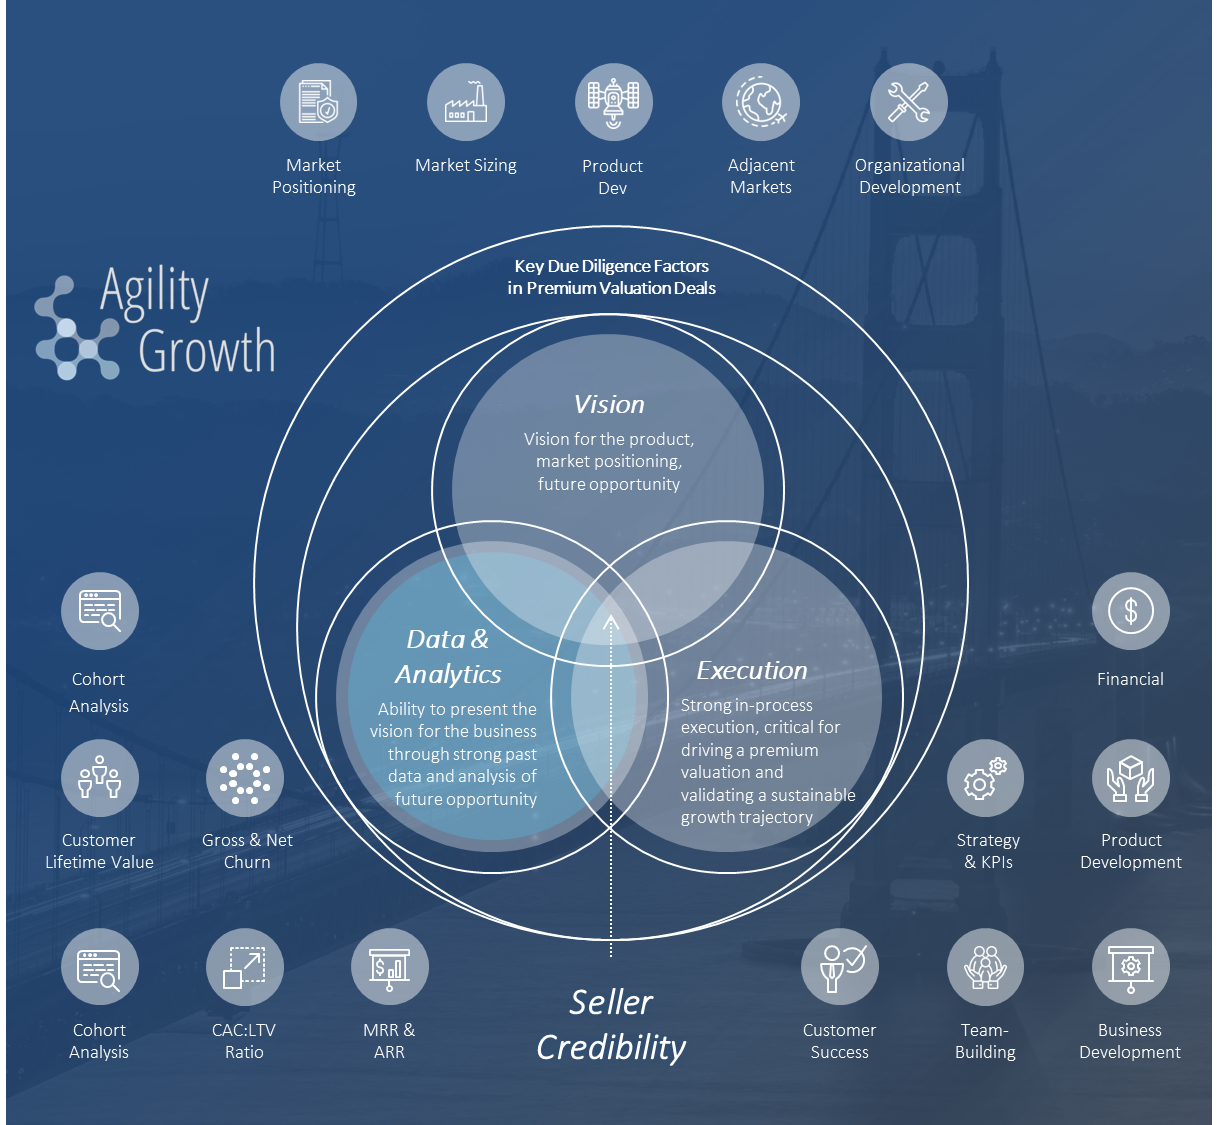
Figure 1: seller credibility in M&A transactions (data & analytics highlighted)
In my last post, I introduced some concepts related to M&A earn-out and retention payments. As promised in my last M&A credibility post, today I am going to present the next layer of detail on SaaS metrics that help show buyers that a business is growth-ready and worthy of a premium valuation.
In my previous post on credibility, we began digging into one of three credibility-impacting factors: data and analytics (highlighted in light blue in the Venn diagram at the start of this post). In that post, I began explaining why such metrics are so critical in establishing a premium-valuation bidding environment while focusing on what they can signal to a buyer about a business’ readiness to unlock its next wave of growth. Today, we will cover many of the metrics in the “growth zone” highlighted in blue in the visual below, defining them at a high level and including a comment or two about what those metrics can tell an investor or buyer about how prepared (or unprepared) a business is to grow post-transaction.
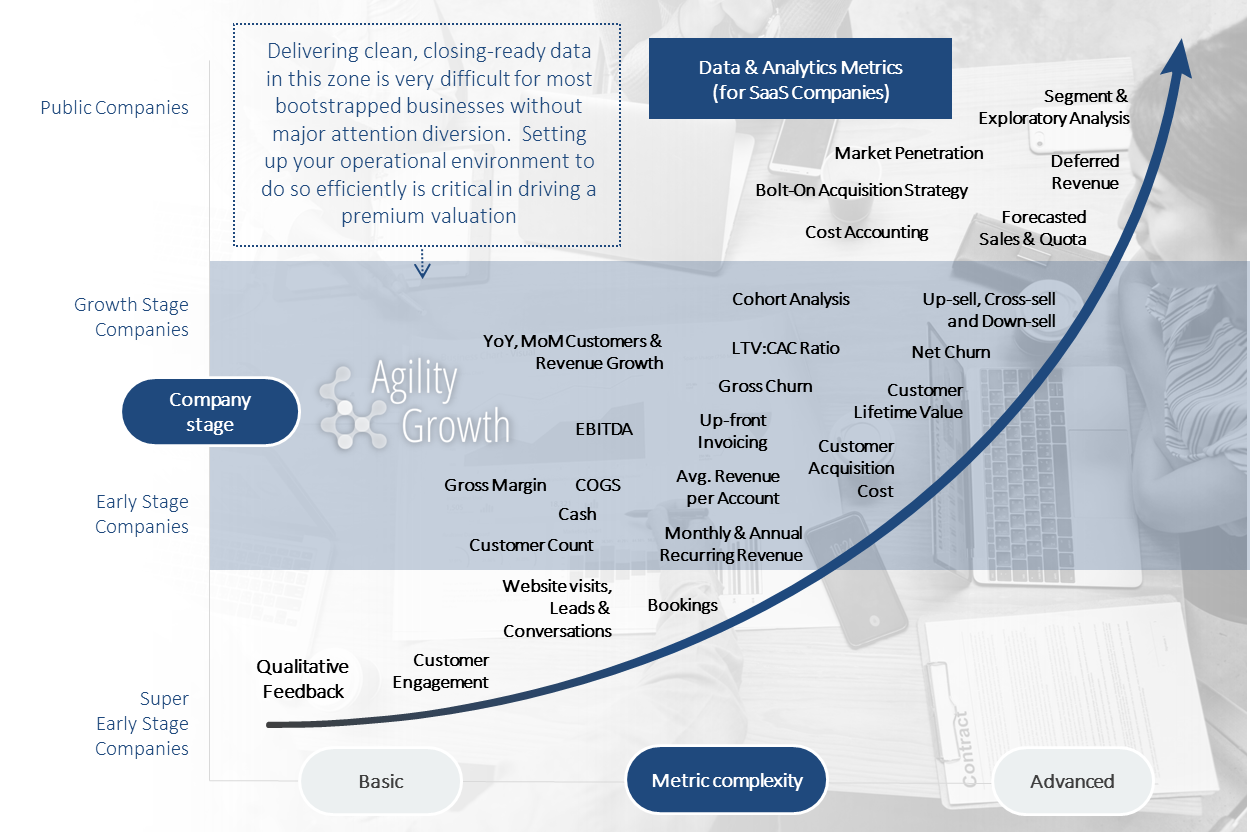
Figure 2: important SaaS metrics (highlighted) in high-multiple capital markets transactions
As was covered in my last M&A credibility post, the visual above provides insights into the important metrics that a buyer / investor will look for at each stage in a company’s lifecycle in order to justify high-multiple, premium M&A (as well as growth buyout and growth investment) transactions. While each of the metrics in the foregoing chart is nuanced in what it can tell a buyer / investor about a business, the cumulative “evidence” combines to deliver a business validated as growth-ready and future-fortified (i.e. worthy of “premium” value if the metrics compare favorably to other market participants). Some of the most important and foundational in proving growth-readiness are introduced below. I will cover the remainder of the more important metrics in a 2nd introductory definitions post. Finally, I’ll dedicate a number of future posts to a deeper dive into individual metrics that are more complicated or nuanced and that are critical in driving a robust M&A market with premium, high-multiple valuations. I will also dedicate a future post to discussing why measuring such things can be difficult (or at least necessitate a change in mentality) for the average bootstrapped SaaS company.
MRR
Most SaaS operators are familiar with this term. MRR is an acronym for Monthly Recurring Revenue, which is a simple measure of your accrual monthly recurring revenue. While thinking about and interacting with MRR can become more complicated if a company presents its financials on a cash basis and collects large up-front payments in association with its customer contracts (i.e. would have meaningful deferred revenue under generally accepted accounting principles [“GAAP”]), MRR is quite simple as a concept. It is a metric comprised of all of a company’s recurring revenue accrued monthly in accordance with GAAP. When MRR is broken down into its component parts, it becomes especially useful to potential M&A partners in considering the business’ health. Five components of total MRR include:
- New MRR — MRR from new customers
- Expansion MRR — New MRR from existing customers (not present when they first became customers), often coming through upsells or growing residuals from partners like payment providers
- Reactivation MRR — MRR from previous customers that have churned and then come back
- Contraction MRR — Lost MRR from existing customers that are retained (downgrades)
- Churned MRR — Lost MRR from leaving customers
As it pertains to growth readiness, MRR is clearly more valuable to a business than other forms of non-recurring revenue as it provides much more leverage and predictability for future growth than one-time revenue.
*More to come on MRR in future posts.
ARR
For the sake of this post, let’s just say “see above” and convert from “Monthly” to “Annual.”
Customer Acquisition Cost (CAC)
Customer Acquisition Cost or “CAC” is the cost associated with convincing a customer to buy a product or service. These costs include fixed costs like sales and marketing salaries and benefits as well as sales and marketing software products. They also include variable costs like affiliate payouts, Google Adwords spend, and sales commissions. CAC is an important SaaS business metric as a component of net customer value and the resulting return on investment (ROI) from acquiring a new customer.
As it pertains to growth readiness, CAC helps a company decide how much of its resources can be profitably spent to gain a new customer and how aggressive the company can be in sales and marketing. In order to make it an actionable or insightful metric, customer acquisition cost is typically expressed as a ratio — dividing the sum total of CAC by the number of additional patrons acquired by the business as a result of the customer acquisition strategy (the LTV:CAC ratio, which I will introduce in a moment).
Customer Lifetime Value (LTV)
Customer Lifetime Value or “LTV” is an estimate of the average gross revenue that a customer will generate before they churn (cancel). As an extremely important term in considering the future prospects of a SaaS business, there are layers to sophistication related to how one might think about LTV. However, for the purposes of this short definition, the foregoing is sufficient. A basic formula for LTV that is broadly accepted as a useful foundation for estimating the LTV of a SaaS customer is Average Revenue per Customer / Customer Churn Rate. That said, because this formula doesn’t properly account for things like Expansion MRR, Contraction MRR, and doesn’t account for the fact that churn doesn’t occur linearly (among other nuances), it is only a rough starting point to a nuanced, important discussion. As it pertains to growth readiness, LTV can be combined with CAC to help management decide how much of its resources can be profitably spent to gain a new customer through the LTV:CAC ratio, which I will introduce next. An important concept that the LTV:CAC ratio does not address is timing, specifically the timing of cash flows in and out. For example, if a company’s customers churn at a rate of 5% annually and have an average annual revenue of $500, their gross LTV is $10,000. If their CAC is $1,000, they still have an excellent 10:1 LTV:CAC ratio, but don’t return the CAC spend in full until the end of the second year. This is referred to as the “CAC Payback Period” and is an important consideration to a bootstrapped SaaS company in their cash management planning.
*Much more to come on CAC, LTV, and Payback periods in future blog posts.
LTV:CAC Ratio
Because I am just past my self-regulated 1,000 word limit for this post, LTV:CAC will be my last introductory definition for today. I’ll cover cohort analysis, churn, net churn, upsell / cross-sell, down-sell and a number of other definitions from the “growth zone” highlighted in blue in Figure 2 (above) in a future post. Since we covered each of LTV and CAC above, the LTV:CAC ratio should be easy to introduce here, though like the other definitions, its nuances and value deserve a blog post of their own. Simply put, LTV:CAC is a ratio that compares the value of a customer over its lifetime to the cost of acquiring the customer. If a company’s LTV:CAC ratio is less than 1.0, it is destroying value; if the ratio is greater than 1.0, the company may be creating value, though more analysis would be required; and generally speaking if the CAC:LTV ratio is greater than 3.0, a company would often be considered “good” at profitably / efficiently acquiring customers. However, as I said above, these metrics are nuanced, so even a 3.0 CAC:LTV ratio can’t be considered a “bright line” for determining whether a SaaS company is succeeding or not in its customer acquisition efforts. Some reasons for this include:
- That contribution margin is not always the appropriate gauge for determining economic benefit. This is because many companies have significant fixed costs that should be included in analysis of customer acquisition efficiency.
- Churn rates / retention rates often change with time as addressable markets mature, products grow, customer success improves, etc.
- Customer acquisition costs also change with time as brand value expands / diminishes, new more or less efficient acquisition channels are utilized, competition becomes more or less fierce, etc.
With the forgoing being said, certain LTV:CAC ratios (say a ratio of 15:1 in a 75% ARR growth business) would certainly show a business to be growth-ready as an undeniable signal of efficiency in sales and marketing + product quality execution.
*Much more to come on LTV:CAC ratios in future blog posts.
Note: I love connecting with like-minded finance folks, entrepreneurs, and other humans. Feel free to connect with me on LinkedIn and / or Twitter if you’re so inclined.